
The month of June started with an important Monthly HH that took out also the High of April which is also the last Weekly swing High. For the longer term, this thrust is a bullish signal to get to the 2180 area, above the all time high of 2134. In the previous review we mentioned a bullish scenario that might take out the all time high and continue towards the Upper Bollinger Band, so this signal is a candidate for that. But the current correct stop loss for such a position can’t be closer than the Weekly swing Low, at 2022, what makes it unrealistic for most retail traders.
Another way to handle it, is to wait for bullish activity, and buying a break up above Friday’s High with a stop below Friday’s Low is much more realistic. In that case, we have to be aware of the higher timeframe involved, in this case the Semiannual bar which is about to close by the end of June. Chart1 shows both the Weekly and the Semiannual timeframes, with this signal’s target mentioned here, at 2180.
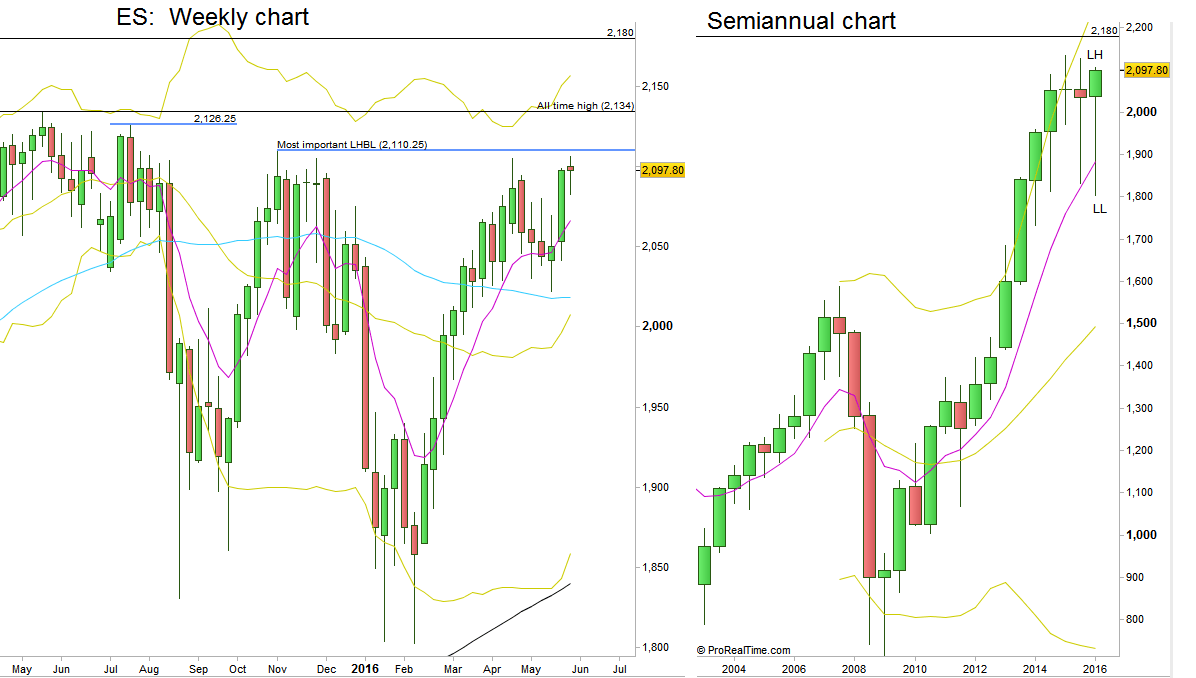
Chart1: SP Futures, Weekly and Semiannual (at the courtesy of prorealtime.com)
The current Semiannual bar is still a LH LL bar, and for this bullish scenario to work, the current Semiannual bar should become a bullish OKR, a very unusual price action when done at all times high. Of course, everything is possible, but we should be very suspicious and being aware of it. Yes, price can even consolidate and “wait” for the next month to make the break up so that it would be only on the next Semiannual bar, and continue the move… But what are the chances to see such harmonic behavior?
***
After the above mentioned important thrust up in which the Daily range extended to the upside, the NFP report on last Friday caused a price extension to the downside as well, as prices took out the low of the daily range, finally closing the week at the mid Daily range. So, by looking at the daily price action, we can notice a Megaphone pattern emerging, basically meaning in this context a stopping action, i.e. likelihood for more consolidation in the current Monthly range.
If by Monday, the price action reveals weakness, most chances to see the price takes out the last Low of Friday at 2082.75, and that would be a short term bearish signal to reach the Daily 50 SMA at the 2070 support level. Since there is a strong support level at 2080, it is wiser to take that bearish signal only after the expected reaction, with proven new signs of weakness and a lower timeframe bearish signal (chart2).
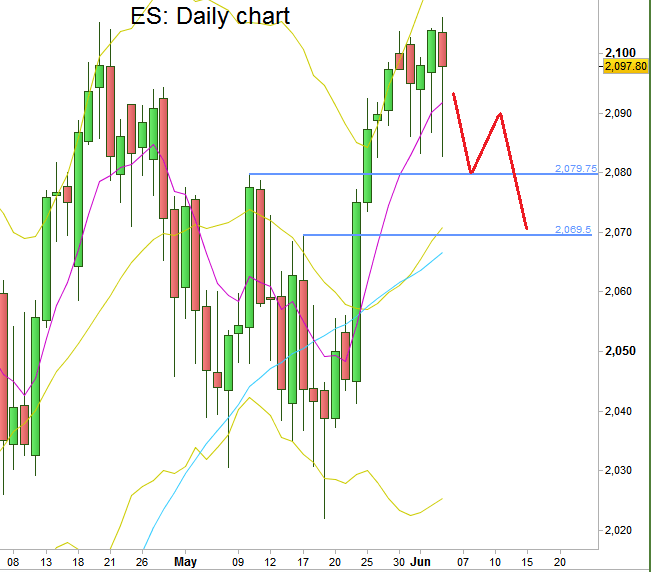
Chart2: SP Futures, Daily chart (at the courtesy of prorealtime.com)
To summarize, we can see that the last Friday’s Daily bar is a crossroads. Above its High, it is a Bullish signal with the problematic Semiannual bar formation. Below, it is short term bearish signal that might lead to more consolidation within the May Monthly bar’s range.
Disclaimer: Anyone who takes action by this article does it at his own risk and understanding, and the writer won’t have any liability for any damages caused by this action.