
Like the Dow and the Nasdaq, the SP500 printed a big Upthrust bar due to the news from the UK. And like the other two, this big Upthrust didn’t take out first the top of the last major range, so to deduce here that this is a major change of behavior that should start a whole bearish market – is very early and incorrect.
The bullish setup mentioned in the previous reviews, with the SL below the Weekly swing low at 2022 has finally been negated.
Examining deeply the Daily and the Weekly bars, the former didn’t manage to close below the important 200 SMA, whereas the latter couldn’t with the important 50 SMA as well. This subtlety shows that it is not that bearish as it seems to be, and the market may have time.
It doesn’t negate however going lower further this week, and indeed, currently there is a bearish setup to reach the mid range area, at 1960, while the true stop level currently is above this Weekly Upthrust bar, way below a level it may become attractive in terms of Risk/Reward. On a weak market, it might be a move within one more bearish day. On a stronger market, an opportunity to join this setup would be if we see first a consolidation in the following days, giving a good bearish signal on the daily timeframe pointing to the target at 1960 area.
A strong support area currently lies down 4 to 9 handles below the Low of last Friday, at 1990 to 1994. So, the above mentioned consolidation before going lower might start just by taking out these levels. The next major support area is at the target, 1951 till 1964. Further signs of weakness might bring another decline, to the most important support area around, at the 1940 level area.
The Monthly, Quarterly and the Semiannual bars are going to close on Thursday, and it is important to watch how they close in relation with the short term sentiment 8 EMA of each. Currently the Monthly is below the 8 EMA, bearish, the Quarterly looks bearish, but currently above its 8 EMA, and the Semiannual is way above its 8 EMA. We will cover them again on the next review.

SP Futures: Daily chart with the main support areas below (at the courtesy of prorealtime.com)
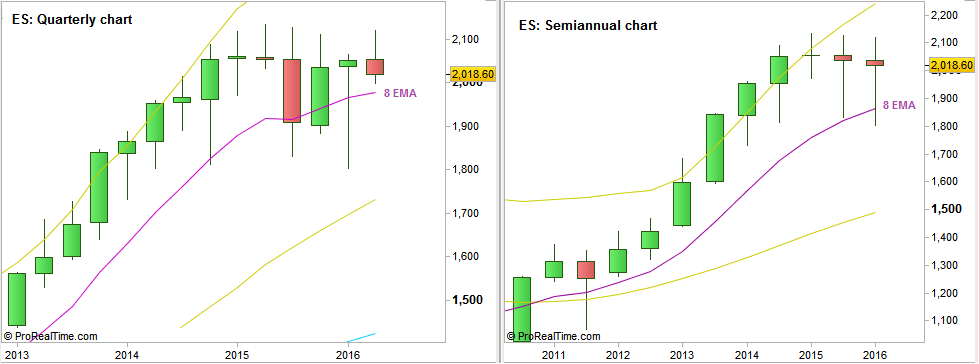
SP Futures: Quarterly and Semiannual charts (at the courtesy of prorealtime.com)
Disclaimer: Anyone who takes action by this article does it at his own risk and understanding, and the writer won’t have any liability for any damages caused by this action.