
The strong close of the passing week brings us back to the indecisive sideways action. The bearish setup target mentioned in last review didn’t reach the 1960 level, and in turn made a remarkable reversal up above the 1980 level. This bearish formation to 1960 is still valid as long as the Monthly High at 2119.5 is still respected, but practically, a thrust above Friday’s bar, the Weekly High, most likely will negate it finally.
The bearish monthly bar just 4 days before the Month closes has turned into a bullish pinbar closing considerably above the 8 EMA, revealing strength.
The Quarterly and the Semiannual bars closed finally on Thursday both as a bullish pinbar leaning on the upward sloping 8 EMA, -another bullish indication for the midterm at least (once their high is taken out, it a trigger to go long by the same amplitude of the pinbar range).
In previous reviews we mentioned the passing Semiannual bar, already had made a deep LL – how unusual it would be for such a bar to make the thrust up and close as a bullish engulfing, right at the all time High. Eventually, we see in hindsight that the price action ever since, especially throughout the whole last month was just buying time in order to close the Semiannual bar still as a LH LL bar though strongly, perhaps preparing the real breakup for the new Semiannual bar that started on Friday. On the other hand, keep in mind that we are dealing with a semiannual bar, and there could be another month or two having the same sideways behavior perhaps testing the Lows once again -prior to the expected break up.
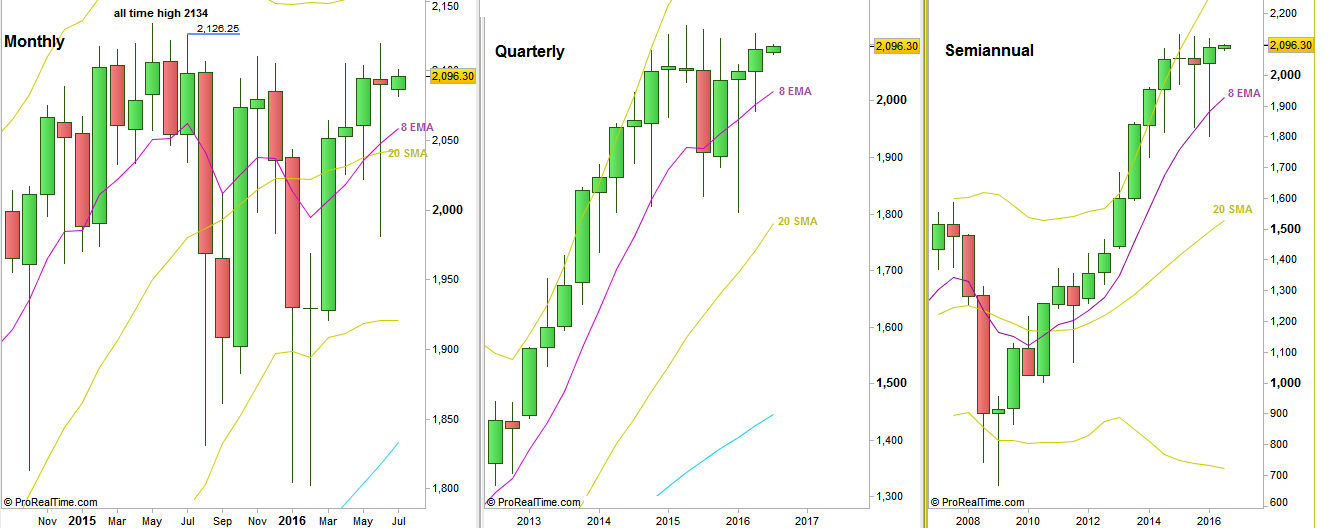
S&P Futures: Monthly, Quarterly and Semiannual charts (at the courtesy of prorealtime.com)
Disclaimer: Anyone who takes action by this article does it at his own risk and understanding, and the writer won’t have any liability for any damages caused by this action.