
The month of August closed as a Doji bar, not touching the upper Bollinger Band, not an exciting sign for the midterm bulls as there is less chance for a Monthly bullish momentum ahead.
As mentioned in the last review, the Daily bar of previous Friday, August 26th did serve as a stopping action, while taking out one of its edges, in this case the lower edge did turn out to be a false thrust down. There are good chances for this behavior to be continued, this time the High of that range (the High of Friday August 26th at 2186.75) is probably going to be taken out, and unless the same momentum will take out the all time High as well, most chances that it will repeat the sideways behavior, folding back inside the range.
Unless the market takes out the all time High, we can’t rely on intra range bullish signals to cross out of the range. More than that, the inability of the price to make a new all time High in such a case – might prepare a potential bearish setup for the week after.
If the market does make a new all time High in the coming week, it is an expansion of the megaphone pattern mentioned before, and most likely the price is going to test once again the mid range of the megaphone pattern after that, from which a good continuation bullish signal might emerge eventually.
The setup of the Weekly bullish pinbar made by the first week of August is still active, with a target at 2212, slightly above the 161.8 extension of the last major correction that took place last June (including the Brexit reaction), at 2205.
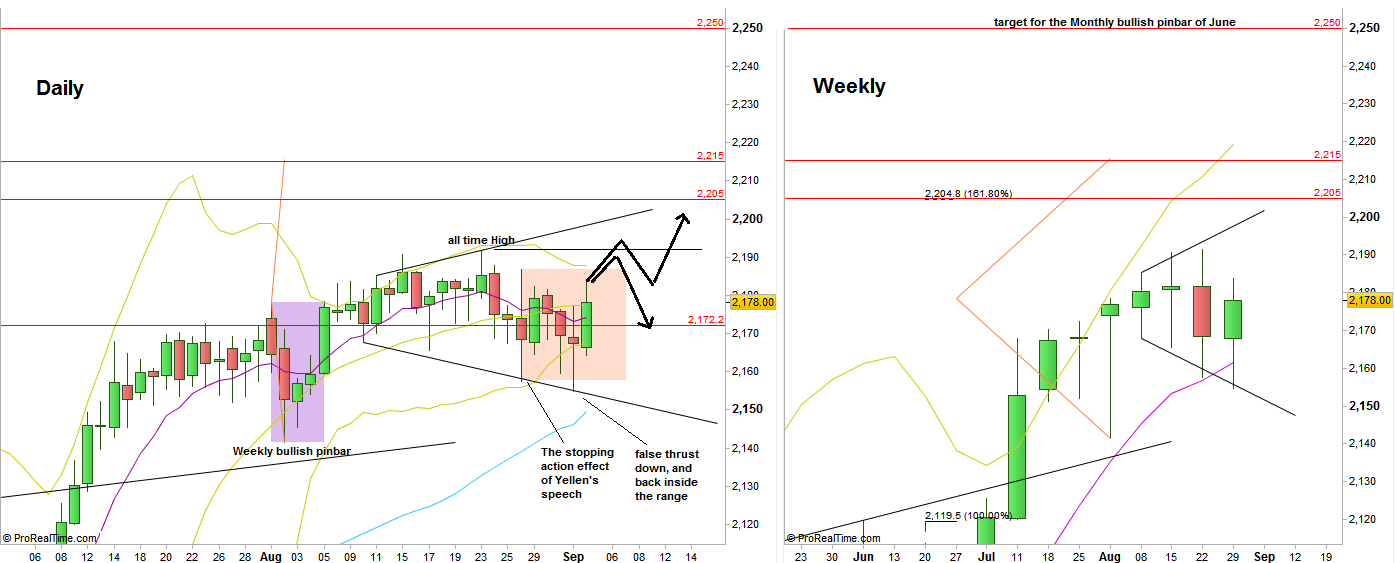
S&P Futures, Daily and weekly charts (at the courtesy of prorealtime.com)
Disclaimer: Anyone who takes action by this article does it at his own risk and understanding, and the writer won’t have any liability for any damages caused by this action.