
Like most of other stock markets, the S&P has ended the year with a minor retracement week, inside the Weekly Bollinger bands, closing as a bullish pinbar on sloping 8 EMA. It is a powerful pattern once its High is taken out on the next bar.
On the Daily timeframe, there is a bearish setup to reach 2215. Since it is the first counter trend signal, better wait for another confirmation. Last Friday, the market closed printing a bullish OKR. Notice the open gap above. In order to take advantage of this retracement to go long, first let the market close the gap, make some pullback again, and on new signs of strength find a good bullish opportunity. Otherwise, a reversal down without closing the open gap might indicate that the bearish setup towards 2215 is very likely to be underway. The Monthly bar supports this further retracement as it closed leaving a long upper tail. The nearest support down below, is at 2213.75.
The Yearly bar of 2016 closed strongly, as an OKR, with a Spring (false thrust down), and as a bullish pinbar on sloping 8 EMA – a very powerful pattern once there is a thrust up on the next bar (year 2017). The Quarterly bar closed as an OKR, Spring and a bullish pinbar on sloping 8 EMA similarly.
Back into the larger picture, we are almost at the target of the huge false breakdown occurred throughout the years 2008 and 2009, pointing at 2300 as the target. This is also the Daily post election day’s pinbar target. Slightly (in these terms) above it is the level of 2330 which is pointed by couple of important signals. The Quarterly bullish pinbar of the 1st quarter 2016, the Weekly false breakdown also a pinbar, also forming an Engulfing pattern, and the engulfing pattern made three weeks ago and has already gotten the thrust up – all these important signals point at the 2330 area as their targets. All these targets should most likely create a mass of Long covering, and we should see some considerable retracement when (if) the price gets there. The 161.8% extension of the last two year retracement lies at the level of 2338.
12 points higher, at 2350, is the target of the Quarterly bullish follow through, and 2400 is the target for the bullish Monthly pinbar of last November that has already gotten a thrust up above its High at the current month, and finally, the Yearly price action points towards 2460 as its target. Again, consider the targets at the 2330 area as an important resistance.
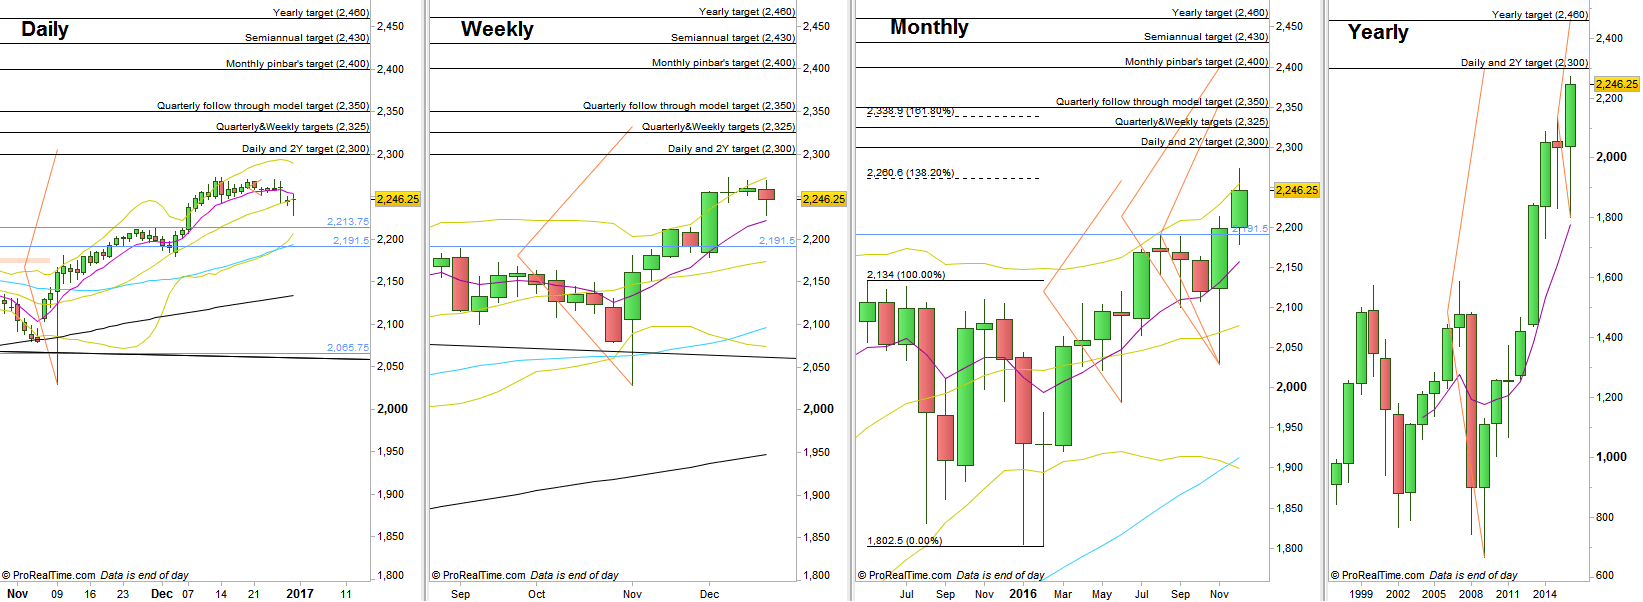
S&P Futures, Daily, Weekly, Monthly and Yearly charts (at the courtesy of prorealtime.com)
Disclaimer: Anyone who takes action by this article does it at his own risk and understanding, and the writer won’t have any liability for any damages caused by this action.