
Another Weekly bullish bar has been printed. The market has reached the 2350 level area, the target for the follow through model since the High of August 2016 (at 2191.5) has been taken out. The important extension of 161.8% to the whole correction taken place from mid 2015 till mid 2016 at 2339 has been reached as well.
As mentioned in past reviews, the market has reached many target points at the current levels, and it is very likely to see some big long covering taking place soon, covering that might put some pressure down for more than what we’ve seen last Thursday and Friday.
Of course there is nothing to talk about Daily timeframe (and above) bearish positions – not before the market enters bearish setups, mislead the early Shorts by taking out stops but then showing new signs of weakness.
However, if the extremity is here and the market keeps on running upwards without a considerable delay, the next targets are at 2400, which is the target of the US Election’s Monthly pinbar (and engulfing pattern) on sloping 8 EMA, the 2430 level pointed by the 2016 first half Semiannual pinbar on sloping 8 EMA, and lastly the level of 2460 where the Yearly Spring model is pointing at.
Again, I would be cautious entering swing long positions here, especially breakout models. I would consider it again if the market doesn’t make any false breakout, corrects, ending the correction by new signs of strength, such as a Daily bullish pinbar on sloping 8 EMA. Even in such a case, I wouldn’t hold a position for more than 1:1 the basic target.
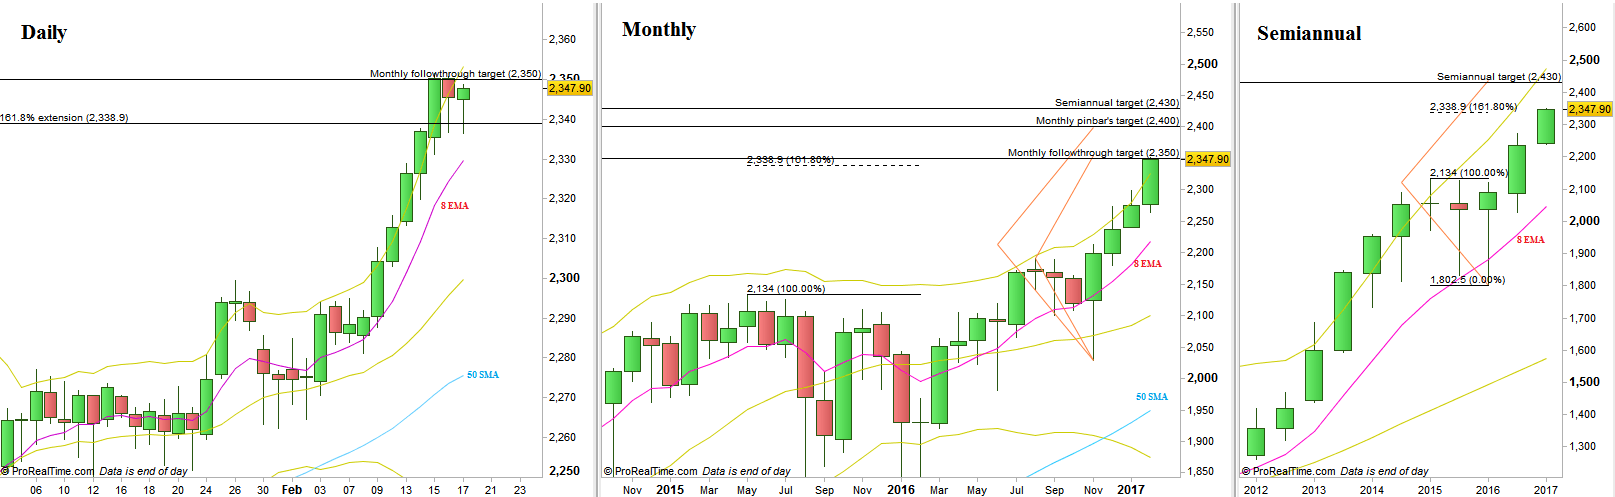
S&P Futures, Daily, Monthly and Semiannual charts (at the courtesy of prorealtime.com)
Disclaimer: Anyone who takes action by this article does it at his own risk and understanding, and the writer won’t have any liability for any damages caused by this action.