
The market has lots of patience these days, and part of this kind of behavior is usually expanding the range it is currently in, which also means shaking out existing short term positions. The short position mentioned last week hit the stop level at 2077.75 only to see the prices turning to be weaker again. But, this is the way markets act sometime, and we should respect it.
The long term view hasn’t changed, which is – any major down move from here should currently be treated as correction before going higher, and this expected correction should most likely making bottom at the 1940 area, a very strong support level.
The question is whether this shaking out is part of a plan to take out another major high before starting the big correction or not. This time it is the November 2015’s High at 2110.25. This is a 3 month Last High Before Low, a very important level which is the most important high before the all time high at 2134.
In order to go short, we need the prices to test first the middle of the daily swing range at 2060~, only then by taking out the Weekly Low at 2038.5, we get a good bearish setup to decline till 2019, that can later develops to the 1994.75 level.
If, on the other hand, the price continues to decline on Monday (taking out the Weekly Low), but doesn’t reach the 2030.5 Low -and then reverses, then going higher above last week’s High at 2079.75 might start a bullish move towards 2112. Strong resistance on the way is at 2090.5.
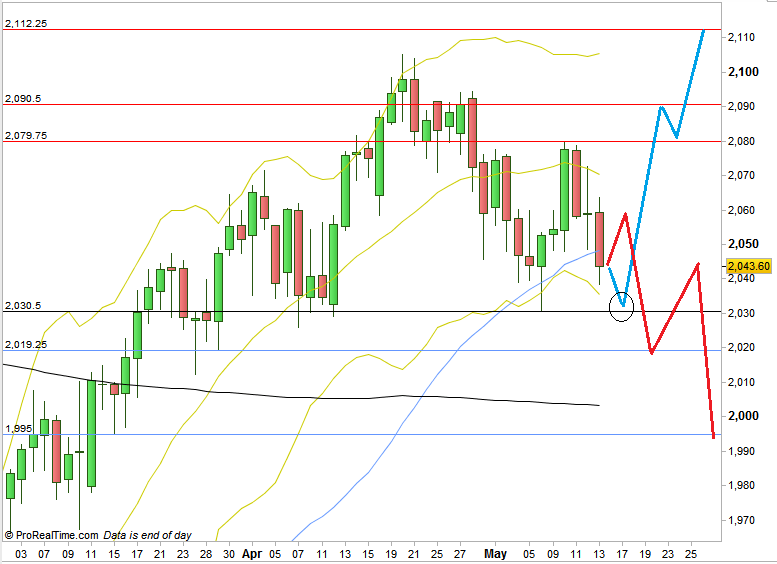
Chart1: ES Daily chart with a sketch of the two scenarios mentioned (at the courtesy of prorealtime.com)
Disclaimer: Anyone who takes action by this article does it at his own risk and understanding, and the writer won’t have any liability for any damages caused by this action.