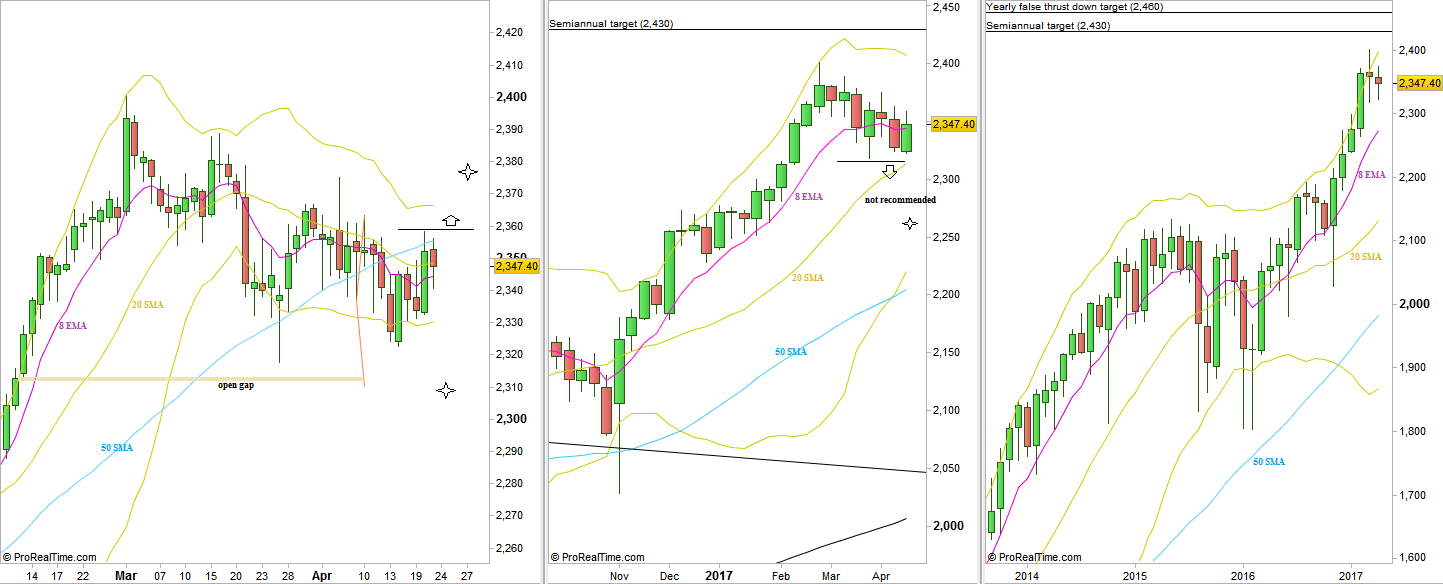
A rather bullish week has passed, respecting the Monthly Low at 2317.75, closing the Weekly bar above the 8 EMA short term sentiment line. But still, it was a LL LH Weekly bar.
Currently, the market is still in a bearish setup to take out the Monthly Low, reaching 2310 before another bounce up is very likely to follow. Pay attention to an open gap lying closely below the Monthly Low 2312.75-2313.75 that can trigger a big correction up, and if stays open after reversing up, can yield even a new all time High.
Taking out the Monthly Low is a bearish setup to reach the 2262 level, but is not a qualitative signal, as it is the first countertrend signal on the Weekly timeframe, and we are after 4 consecutive Monthly bars to penetrate the Bollinger upper band. Even if it works eventually, most chances are to see strong rallies in between that might give better entries on renewing sings of weakness.
if at the beginning of the coming week a weakness is being revealed, then take a closer look at the Monthly Low, as there is still a chance for the price to be supported before taking out the Monthly Low, this time by the Weekly 20 SMA.
On the other hand, taking out the Weekly High at 2358.25 is a bullish setup that is most likely going to negate the bearish setup mentioned above, aiming to reach the level area of 2375-2380, and a “confirmation” of the Monthly Low being respected. A bullish momentum that might follow can take out the most important Last High Before Low of this Weekly correction down, at 2388.7.
Disclaimer: Anyone who takes action by this article does it at his own risk and understanding, and the writer won’t have any liability for any damages caused by this action.

