
Last week we talked about the strategic view of the market at these days, and showed what the Quarterly chart can tell us as for the last two year big range. We mentioned that before a real bullish attempt to take the highs might occur, it is more likely to see some major correction down, and pointed out about the Daily bearish setup, signaled by taking out previous Friday’s Low after holding for at least 2 days.
Well, the market did wait 2 more days and did take out that Low, but on last Friday, after the NFP report, the market reversed and finally closed very strong.
Taking out the high of last Friday is a good bullish signal to reach the mid Bollinger band (20 SMA) level.
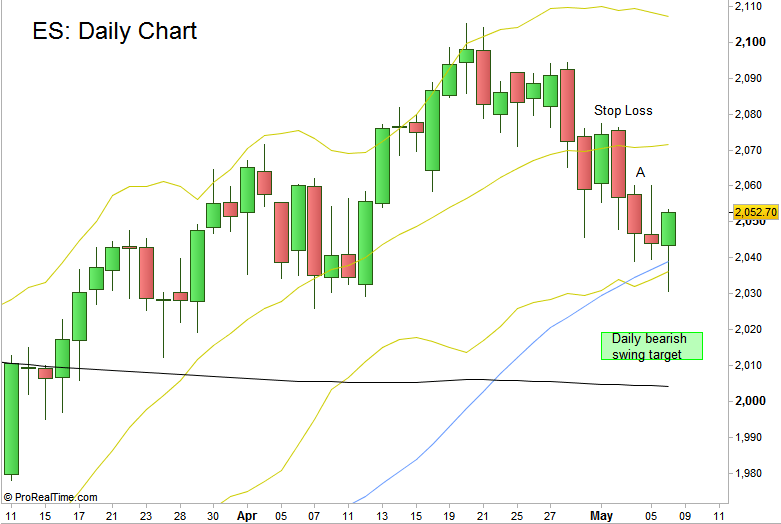
The current bearish attempt that has already fired last week should still be valid, as long as the Daily Swing high at 2077.5 is being respected.
An early answer whether the current bearish attempt has failed or it is just another manipulation might come from the coming Monday’s price action.
If on Monday (9-MAY-2016), the price takes out the high of 2060.25 (Wednesday’s high, point A on chart1), we should assume that the current bearish attempt has failed. It doesn’t necessarily means that a new bearish attempt should not emerge right after, but taking out the last Daily Swing high at 2077.5 is very likely to happen as a result, so it might be better to cut the loss small rather than to wait for the Stop to probably hit.
If Monday’s price action doesn’t take out the 2060.25 high (though the level can be taken out on the days after), we should assume that the bearish attempt is still valid, and this might be some kind of manipulation (Stop Loss remains above 2077.5). Target for the bearish Daily Swing is at 2012-2019 ~.
S&P Futures : Daily chart
Chart1: ES Daily chart (at the courtesy of prorealtime.com)
Disclaimer: Anyone who takes action by this article does it at his own risk and understanding, and the writer won’t have any liability for any damages caused by this action.