
After more than a year, the all time High of 2134 has finally been taken out. The whole Yearly correction since 2015 can be considered as a corrective Elliott Wave 4, while now we might be “officially” at Elliot Wave 5 of the Bullish market since March 2009.
As mentioned in the last review, except for the Quarterly bullish pinbar (target at 2250~) there isn’t any bullish price action setup on the smaller Weekly and Monthly timeframes and the last major Weekly price action was a megaphone, so it won’t be surprising to have soon a big corrective and consolidation phase of a Quarter before going probably higher to 2250.
The weekly bar has penetrated the upper Bollinger Band considerably. The coming week is going to penetrate the upper band as well, so it is not correct to look for bearish signs on the Daily timeframe not to mention the Weekly, at least not before there is a contra bearish Weekly bar that ends very weak.
The important resistance levels above are the 138.2% extension level of the last Daily bearish move (the BRexit reaction) – at 2172, the forming AB=CD pattern on the Daily timeframe target at 2189 and the 161.8% extension level of the BRexit reaction at 2205.
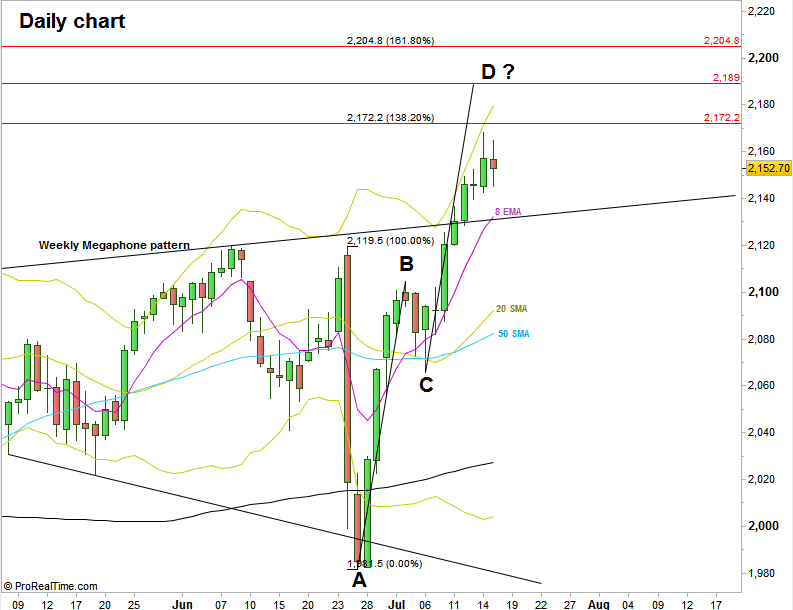
S&P Futures, Daily chart (at the courtesy of prorealtime.com)
Disclaimer: Anyone who takes action by this article does it at his own risk and understanding, and the writer won’t have any liability for any damages caused by this action.