
After reaching the target of last November’s Spring at 2400, the month of March ended eventually as a relatively wide range bar closing in the middle. This is not a classic Doji, not in the shape and not by the meaning, and is more kind of a stopping action bar. The fact that on the Monthly timeframe it has been the 4th bar to penetrate deeply the upper Bollinger band means a strong bullish momentum, therefore, in case the market takes out the Monthly Low at 2317.75, a good practice will be to look for a false thrust down, rather than an opportunity to short the market (both meant in a Monthly scale).
The first Quarter of 2017 ended as a bullish bar, not closing at the high, nor reaching the Quarterly upper Bollinger band, losing the strong momentum it had on its first 2 thirds.
So, by the Monthly and the Quarterly timeframes, a scenario of more consolidation in the last month’s range is likely to happen.
The nearest long term target is the 2016 1st Semiannual pinbar, on sloping 8 EMA, at 2430, closed to the current level of the Quarterly upper Bollinger band.
In the shorter terms, the Daily price action looks like it has managed to overcome the main resistance area at the level of 2357, and the current Daily bullish setup points at 2372 as its target. The High of March 21st at 2378.75 is very likely to be taken out as well in the current Daily trend up (though a testing of the 2350 level might occur first). The Weekly bar closed above the 8 EMA short term sentiment line, a sign of strength.
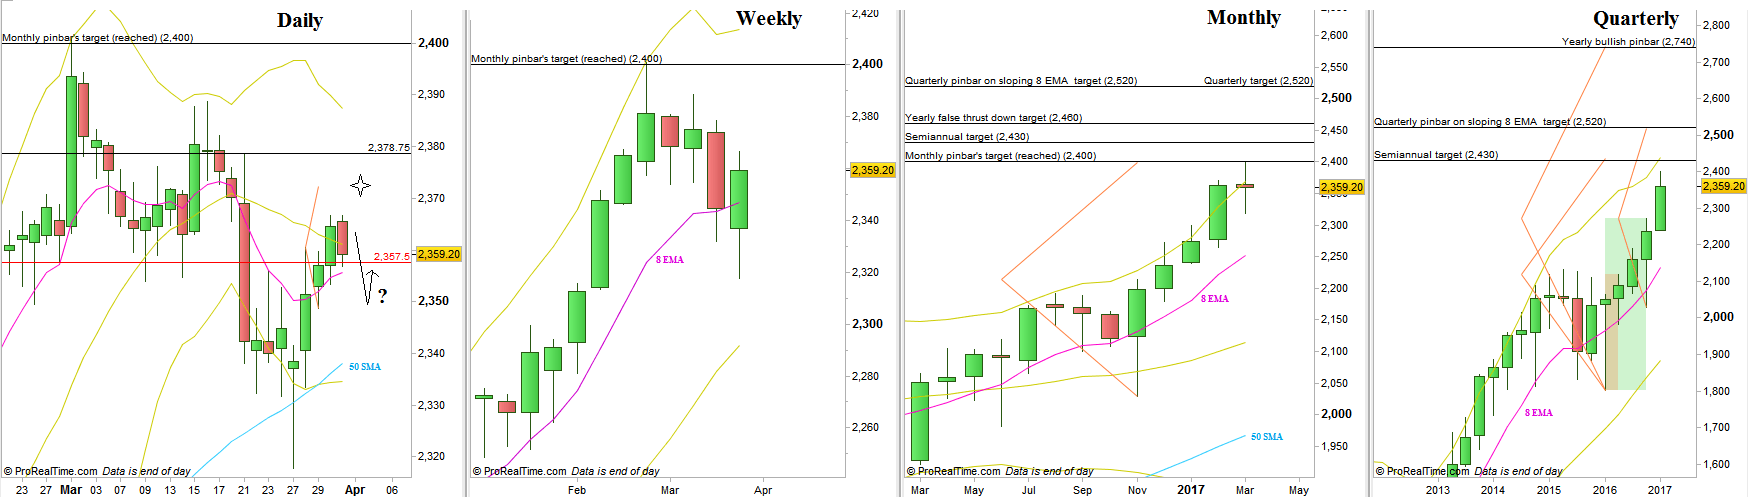
S&P Futures, various timeframes (at the courtesy of prorealtime.com)
Disclaimer: Anyone who takes action by this article does it at his own risk and understanding, and the writer won’t have any liability for any damages caused by this action.