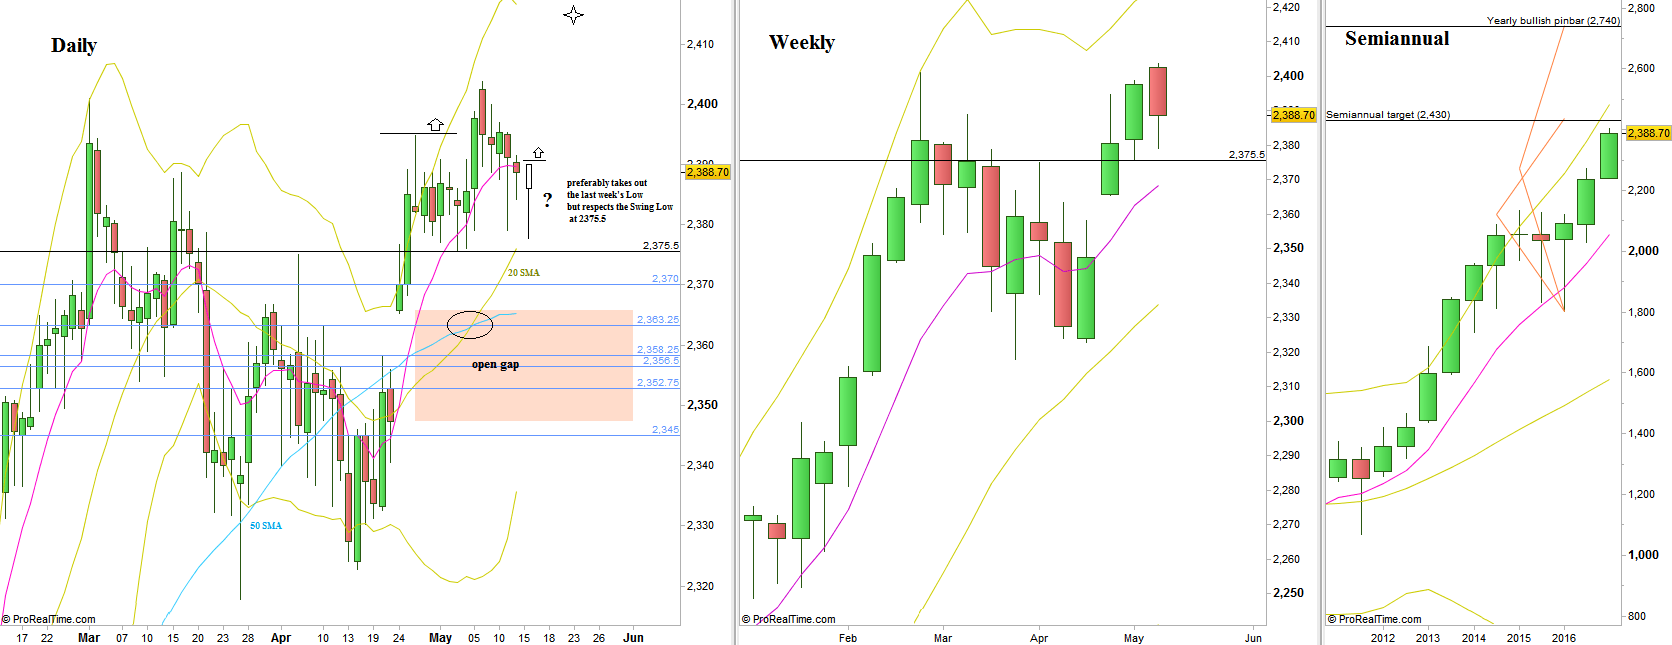
The passing week has started with a gap up and a new all time High, but reversed almost immediately to close the gap, continuing mostly down for the rest of the week. Eventually the market has printed a HH HL Weekly bar, closing far above the Weekly 8 EMA short term sentiment line, and far above the Daily 50 SMA as well, clear signs of strength.
The market is still in a bullish setup to reach the level of 2414, as long as the previous Weekly bar’s Low at 2375.5 remains respected (Stop level below 2375.5). The fact that the Daily 20 SMA has crossed the Daily 50 SMA upwards (and has already corrected towards the crossing level) can give good back wind to this bullish setup.
Another good interesting bullish opportunity might come from testing again the Weekly Low, preferably taking it out (!) while immediately reversing up, i.e. respecting the Low at 2375.5, and closing as a bullish Pinbar leaning on the sloping Daily 20 SMA. In this scenario, taking out the High of that Pinbar is a very good trigger to go Long till the next target at 2414.
As for the bearish side, the market is currently in a potential Double Top formation, but it is much too early for a bearish Swing. Even taking out the 2375.5 Low rejects the current bullish Swing setup, but it is most likely going to be just for testing again the open gap below 2347.5-2365.25, probably giving a good bullish signal right after.
The next major target lying above is the first 2016 Semiannual bar, a Pinbar on sloping 8 EMA pointing at the target of 2430-2440.
Disclaimer: Anyone who takes action by this article does it at his own risk and understanding, and the writer won’t have any liability for any damages caused by this action.

