
After the shakeout in the first bearish setup (mentioned 2 weeks ago), that followed by signs of weakness, the most important Low before the high (at 2026) – throughout the whole up move since February this year, had been taken out.
Unless we see this week contradicting signs of a false break down, and signs of strengths, the market did signal by most chances that a major correction towards the mid range has started.
As mentioned in the last reviews, based on the Quarterly price action, again, the long term view hasn’t changed, which is – any major decline from here should currently be treated as correction before going higher, and this expected correction should most likely be supported strongly at the 1940 area.
As for the daily timeframe, currently there is a bearish setup till 1994-2003 levels, with a stop loss above 2069.5.
A rally towards the Daily 20SMA (mid Bollinger Bands) followed by clear signs of weakness, with a good short term bearish signal – can be considered for a bearish swing down. Do not compromise on a good short signal as the market seems to have a lot of patience, and I wouldn’t be surprised to see another shakeout above the stop loss level of 2069.5 just to watch it turns into a false thrust up again followed by another bearish signal.
So, this potential decline can be a weekly downtrend rather than a direct down move, made of many wide fluctuations, eventually crawling down slowly and very misleading, as opposed to the previous major move up (February till April) which was very determined, high momentum up move.
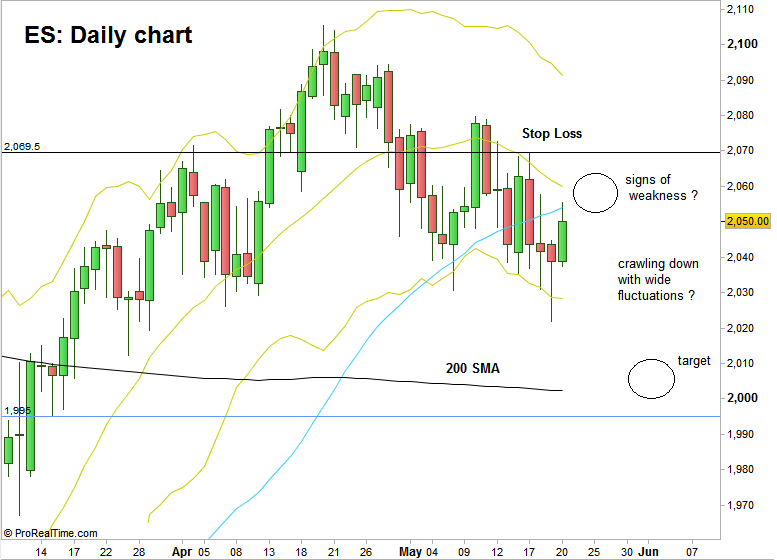
ES: Daily Chart (at the courtesy of prorealtime.com)
Disclaimer: Anyone who takes action by this article does it at his own risk and understanding, and the writer won’t have any liability for any damages caused by this action.