
Perhaps the “Dilemma” about the Semiannual bar that is about to close by the end of June mentioned in the last review, and the market being in a 10 points backwardation, have led the passing week to close much weaker. It happened after taking out both April and May Monthly Highs, again, a midterm bullish signal with a target at 2180 area. So maybe the market does intend to hold the thrust up – till the current Semiannual bar is closed, or till news are released (e.g. the UK European union poll).
For the bullish side, a Daily and above bullish swing can be considered only by taking out the Weekly High again.
For the bearish side, beware of weekly thrust down that might turn into a false thrust, and further consolidation. As for the September contract (ESU6), strong support lies at the 2071.5-2069.25 area and the 2064.25-2061 area.
Unless the Weekly high is taken out, most likely the coming week continues the consolidation process at the last two month levels, with false thrusts down into the 2060-2072 area.
Here is the Daily chart with main support and resistance levels for the September contract.
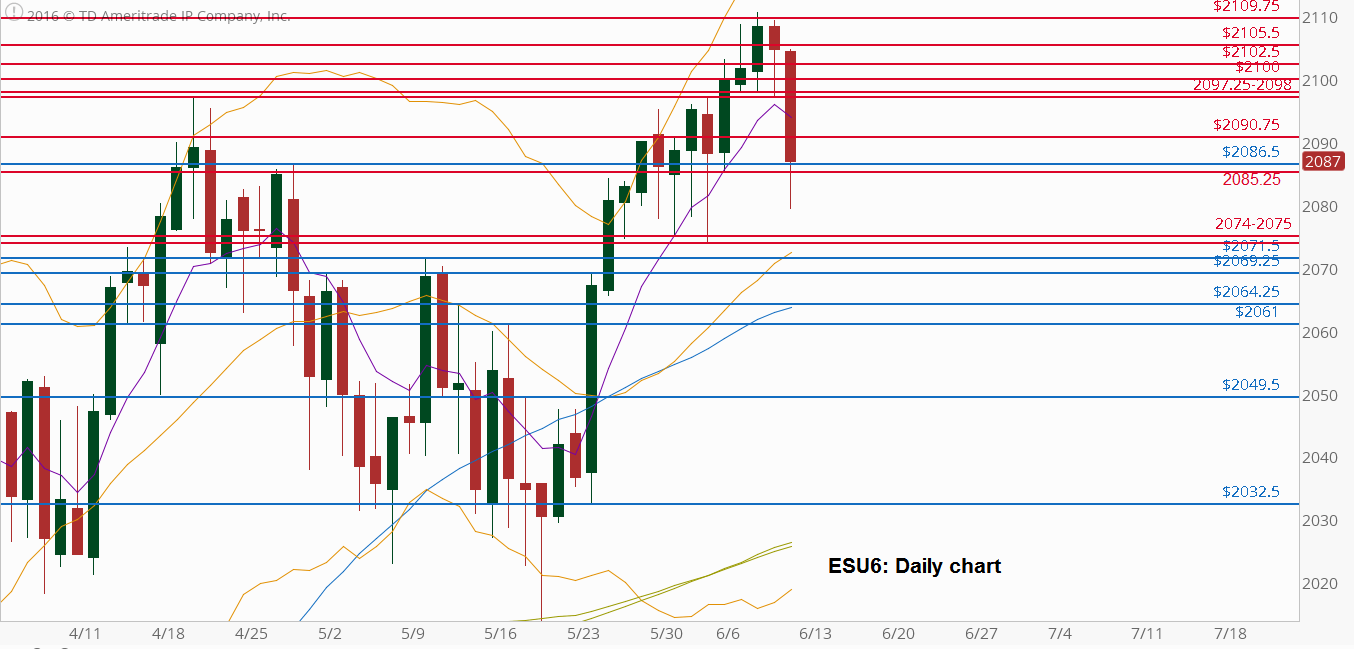
S&P Futures: Daily chart with main support and resistance levels (at the courtesy of thinkorswim.com)
Disclaimer: Anyone who takes action by this article does it at his own risk and understanding, and the writer won’t have any liability for any damages caused by this action.