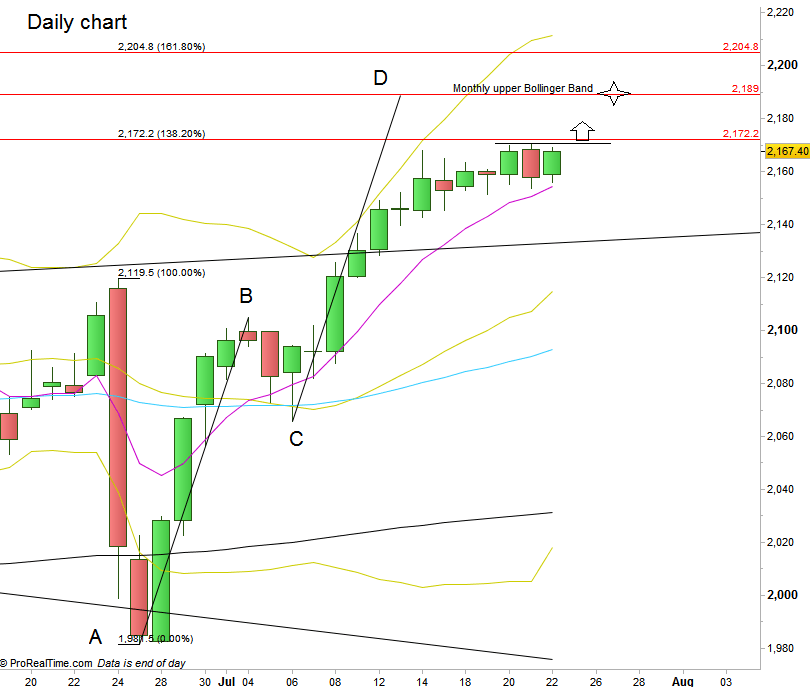
A very narrow range week has passed, and the market made almost nothing but staying in a very small range trading sideways.
We are now slightly above the 161.8% extension of the Whole bearish market of years 2007-2009 at 2156, While the previous all time high at 2134 and the whole big correction since May 2015 may have technically been the reaction to that extension level. Currently we may count that reaction as an Elliott Wave 4 of the Bullish market since 2009 and the bullish wave since February 2016 can be assumed as Wave 5 (probably the last major bullish wave of this market. It is “probably” because there are very rarely exceptions of Waves 6 and 7). However, notice on the Yearly chart, that the current Yearly bar is already a bullish OKR. When this behavior is forming at the top of a move as it is in the current case, most of the times it points out that we are at the extremity of things, and it might finally turn into a topping action (on Yearly scale!).
Taking out the Weekly High is a good bullish setup to reach the AB=CD pattern formed on the Daily timeframe, target at 2189, deep into the Monthly upper Bollinger Band. Pay attention that if the July Monthly bar closes by the end of this coming week without at least touching the Monthly upper Bollinger Band, it should be referred to as a sign of weakness.
Disclaimer: Anyone who takes action by this article does it at his own risk and understanding, and the writer won’t have any liability for any damages caused by this action.


