
Finally, the inability to push up, closing the month of August as a Doji that doesn’t touch the upper Bollinger Band and a considerable backwardation in the new contract for December 2016 (ESZ6) resulted in a vast move down on last Friday.
The previous most important bullish sign, the Weekly pinbar of the first week of August was finally negated by taking out its Low.
It is bearish for the midterm since the market closed the week below the previous primary all time High at 2134. It would have been much more bearish had the price first made a new all time high and then collapsed.
Also, notice that after such a huge Daily momentum down, the market although getting very closely to the Weekly 20 SMA line, didn’t manage to reach and close below it, an important sign of strength.
We are in an area of strong support, an area from which the price has left very fast upward the last time we’ve been here, very closed to the Weekly 20 SMA and the 3 Month LHBL (Last High Before Low) level of 2110.25, going to be mentioned later.
So, it is less likely to see the market continue to decline considerably in the coming week. A Weekly LL is likely to happen, but there is more chance for it to be a false thrust down followed by at least 2 weeks of consolidation inside last Friday’s huge range before making an attempt to go lower.
As for the target of this bearish move, there are good probabilities to reach the 50% retracement level of the last bullish wave at 2087 approximately. That would also give 1:1 amplitude of the Monthly Doji that has just been broken down. A more important lower target can be the 61.8% retracement level of that bullish wave, at 2062. In this case, the price will test the trendline seen clearly in the Weekly chart attached.
Both moves discussed above – the correction up before another major move down – both do not contradict the Megaphone pattern behavior, these targets are exactly at the middle of the two Megaphone patterns seen on the chart.
As for the midterm view, the price action on the Monthly shows good chances that we may have entered – at least – three months of consolidation before another midterm attempt to go higher. The reason is that the most important barrier the market had conquered on the way up was of 3 month LHBL at 2110.25. Pay attention that not surprisingly it is synchronized with the coming elections.
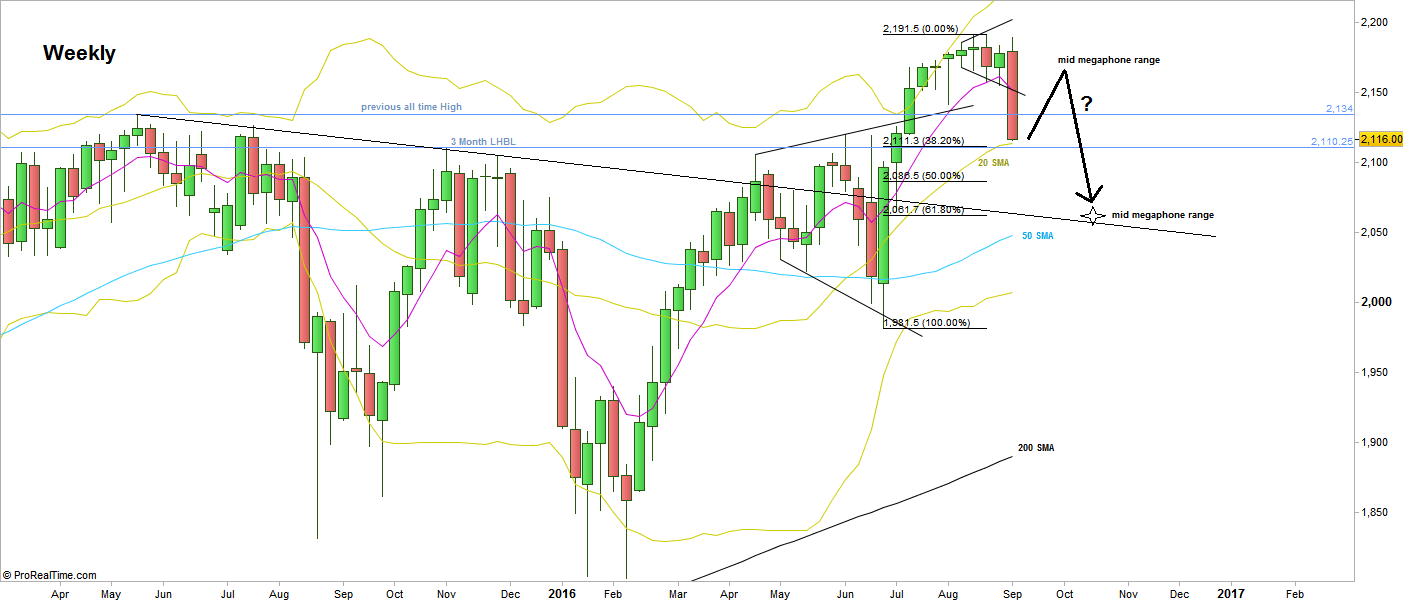
S&P Futures, Weekly chart (at the courtesy of prorealtime.com)
Disclaimer: Anyone who takes action by this article does it at his own risk and understanding, and the writer won’t have any liability for any damages caused by this action.