
As expected, the market has been consolidating (though very volatile, but relative to the previous sharp move down) throughout the passing week.
There are much more chances for another week of correction up than continuing the bearish move the market had started. The Weekly High at 2156 is likely to be taken out. Pay attention for the Daily open gap above (2171.75-2177.50). The current correction up might challenge this gap, and closing it is a clear sign of strength, meaning that above it, it is a good spot for the stops of bearish swings taken. On the other hand, any sign of weakness that appears right after testing this gap’s level, keeping it still open (even as wider as a single tick) is very good bearish signal to take on a thrust down right at the next bar (e.g. a bearish pinbar or an Engulfing pattern).
If the passing week’s High is not taken out throughout the coming week, while instead the price weakens and takes out the Weekly Low, I wouldn’t recommend to go short on that break down, as it most likely should turn out to be a false break down.
A good intra range bullish opportunity might come from taking the High of last Thursday at 2144.50, giving that the Low made before doesn’t touch nor penetrate the lower Daily Bollinger band. If the Low is the current Low, which is the Low of last Friday, then the target points to the crossing of important moving averages – the Daily 20 SMA crosses the 50 SMA downward (bearish). This target is also approximately the mid upper Megaphone’s range, a phenomenon which is very likely to happen once the Megaphone pattern is being broken to either side as it did six trading days ago.
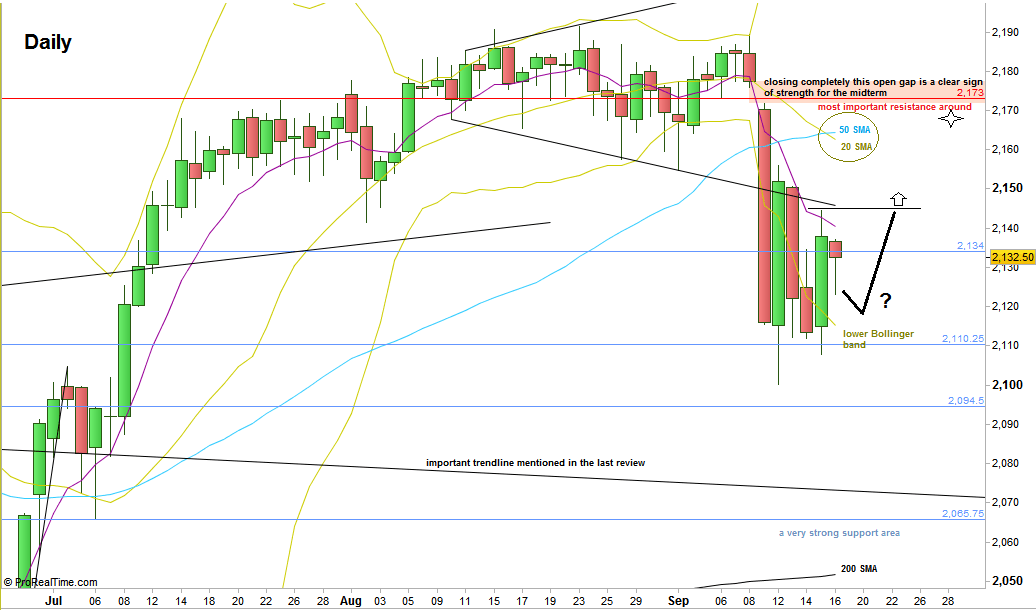
S&P Futures, Daily chart (at the courtesy of prorealtime.com)
Disclaimer: Anyone who takes action by this article does it at his own risk and understanding, and the writer won’t have any liability for any damages caused by this action.