
The passing week ended as an inside bar, quite strong, above the 8 EMA line, has also closed the Monthly bar as well, as a bullish pinbar on the sloping Monthly 8 EMA.
Certainly taking out the Monthly High at 2189.25 is bullish, a signal that can point to 2280 as a target. But other than that, the current price action behavior doesn’t support developing this kind of a scenario.
Instead, this behavior leads by most chances to an upthrust above the current Daily range, meaning a false thrust above 2172.75 into the open gap 2172.75-2177.50.
In that thrust, if happens, pay attention to closing the gap. Leaving the gap open for even only one tick, followed by sign of weakness (e.g. bearish pinbar) and a thrust down the next day is a very good bearish signal.
Inside the current range, unless a new Weekly High is made (above 2172.75), the most important Low to pay attention to is the Weekly (outside bar) Low, at 2126.25. Taking out this Low should continue within the same momentum the price decline to test the support at 2103-2107 levels.
Taking out the Monthly Low at 2100.25 is a bearish signal to reach the 2030 area where the Quarterly 8 EMA is, the Weekly lower Bollinger band and the mid semiannual range. Since this would be the first major bearish sign, I doubt it reaches the target, but most likely in this case we should see testing of the down trend line mentioned in the past reviews (i.e. 2040-2060 levels) the middle of the big Megaphone pattern’s range.
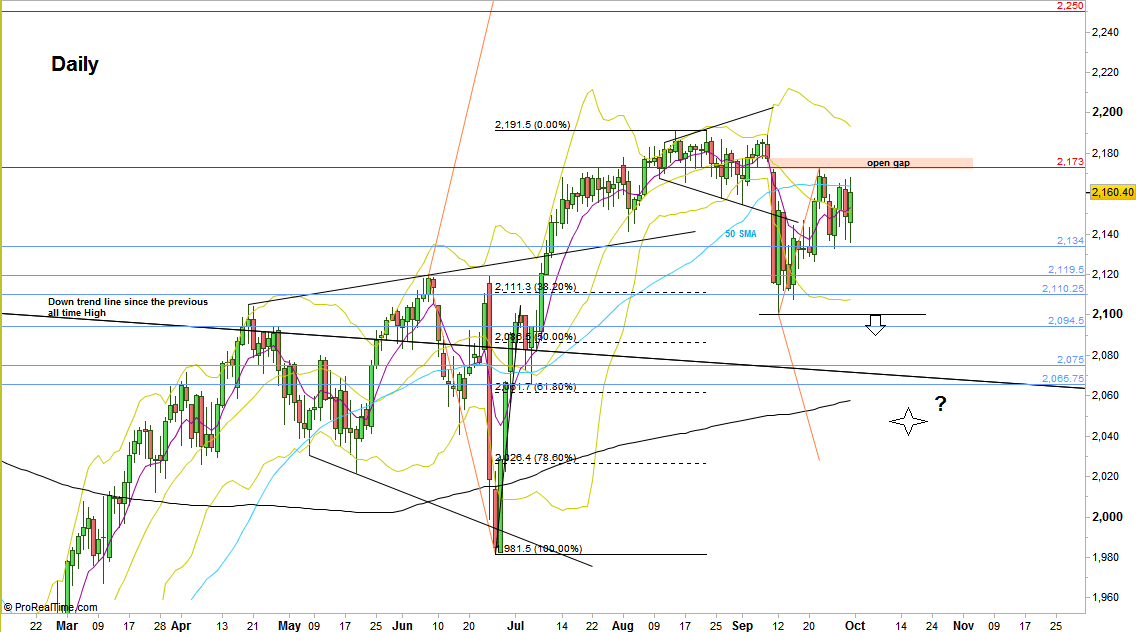
S&P Futures, Daily chart (at the courtesy of prorealtime.com)
Disclaimer: Anyone who takes action by this article does it at his own risk and understanding, and the writer won’t have any liability for any damages caused by this action.