
Six consecutive bullish Weekly bar sequence was terminated by mostly a sideway action LH LL week. The last LL LH Weekly bar that didn’t end as an inside bar took place at the last week of year 2016.
The interesting picture is that currently we have both Bullish and Bearish potential setups.
Taking out the Weekly Low at 2354 is a bearish setup to reach the 2332 level area, but that is less likely to succeed and not a good practice to focus on sign of weakness when the market is still strong on the higher timeframes.
On the other hand, taking out the last Friday’s High is a bullish setup to reach the Daily upper Bollinger band (at 2388).
The market is pretty closed to the target of the Semiannual pinbar on sloping 8 EMA – of the first half of year 2016, at 2430.
Higher targets are the Yearly false break down, at 2460, the previous Quarterly bar which was a bullish pinbar on sloping 8 EMA, already got the a bullish pinbar on sloping 8 EMA, target at 2740.
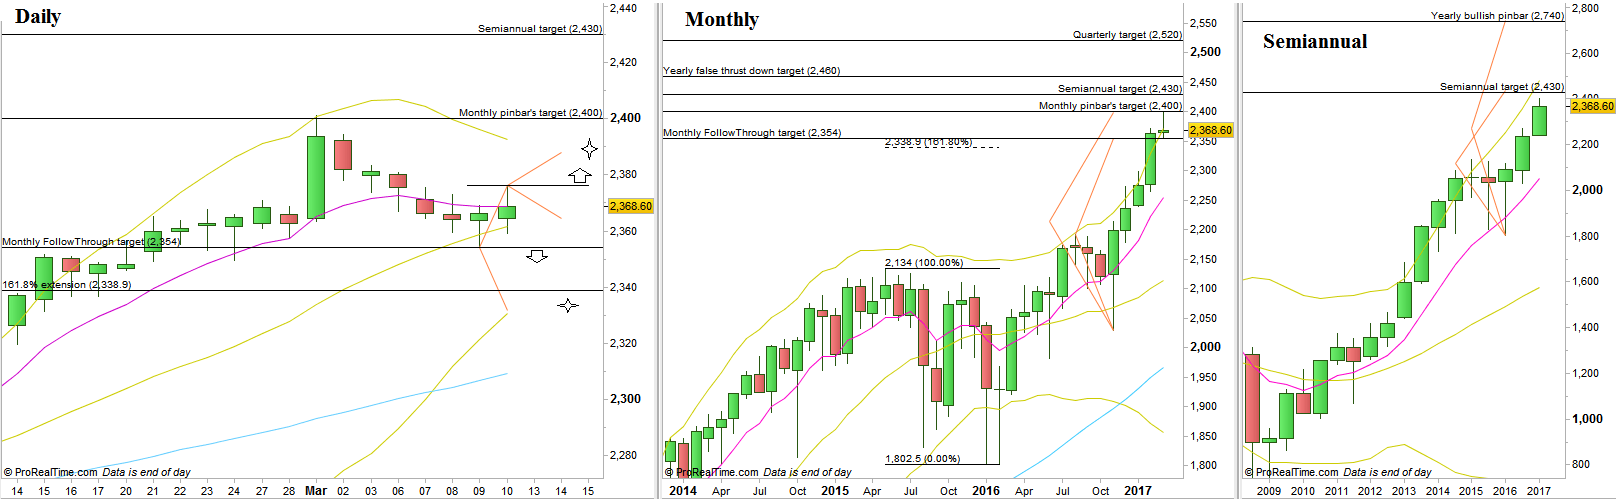
S&P Futures, Daily, Monthly and the Semiannual charts (at the courtesy of prorealtime.com)
Disclaimer: Anyone who takes action by this article does it at his own risk and understanding, and the writer won’t have any liability for any damages caused by this action.